Plot_ly-based functions that are enhanced counterparts to the plotting functions available in the Seurat package. The primary advantage SeuratPlotly has over the standard plotting functions of Seurat are the inclusion of 3D scatterplots of dimentional reductions. For example, DimPlotly3D allows viewing the first 3 UMAP dimensions of of the Villani dataset
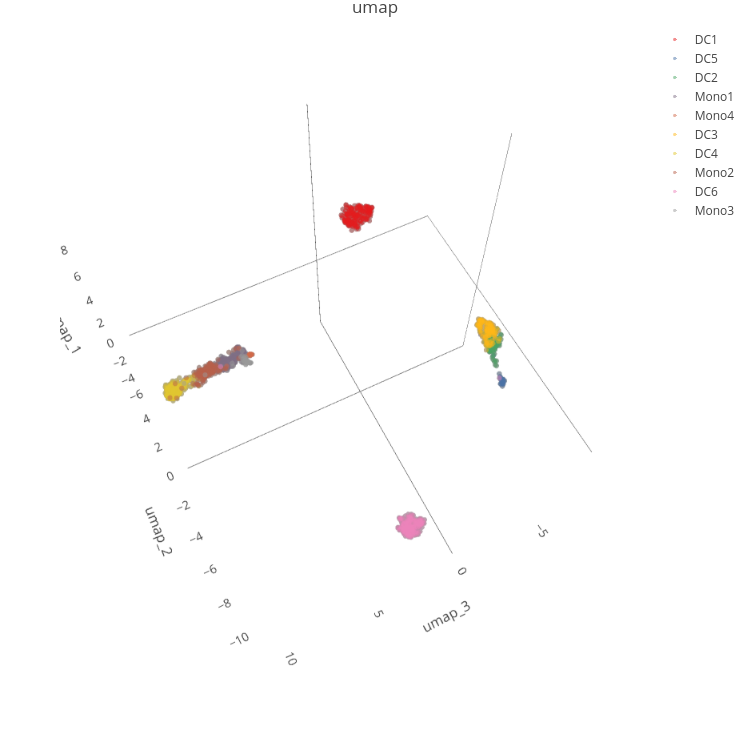 <script data-plotly="milescsmith:1" sharekey-plotly="zKLzhDBe2mTLL2bXpSF5cF" src="https://plot.ly/embed.js" async></script>
(click to interact with the plot) whereas FeaturePlotly3D and Feature2Plotly3D allow for viewing the expression of given features (in this case CD14 and CD16) in 3 dimensions:
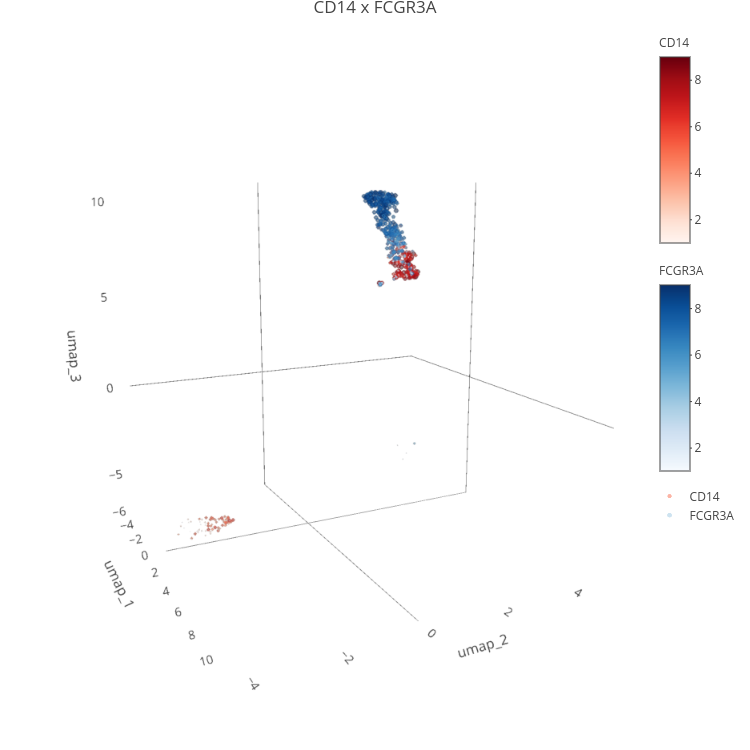 <script data-plotly="milescsmith:3" sharekey-plotly="HV3YP8852vFIInj7eltyae" src="https://plot.ly/embed.js" async></script>