- Installation
- Summary
- Project Instructions
- Project Submission
- Project Motivation
- Results
- Licensing, Authors, and Acknowledgements
You need to be able to work in a Excel on your computer. And you also have some Knowledge of SQL to download Data-set from Udacity through SQL.
In this project, you will analyze local and global temperature data and compare the temperature trends where you live to overall global temperature trends.
Your goal will be to create a visualization and prepare a write up describing the similarities and differences between global temperature trends and temperature trends in the closest big city to where you live. To do this, you’ll follow the steps below:
- Extract the data from the database There's a workspace in the previous section that is connected to a database. You’ll need to export the temperature data for the world as well as for the closest big city to where you live. You can find a list of cities and countries in the city_list table. To interact with the database, you'll need to write a SQL query.
- Write a SQL query to extract the city level data. Export to CSV.
- Write a SQL query to extract the global data. Export to CSV.
- Open up the CSV in whatever tool you feel most comfortable using. We suggest using Excel or Google sheets, but you are welcome to use another tool, such as Python or R.
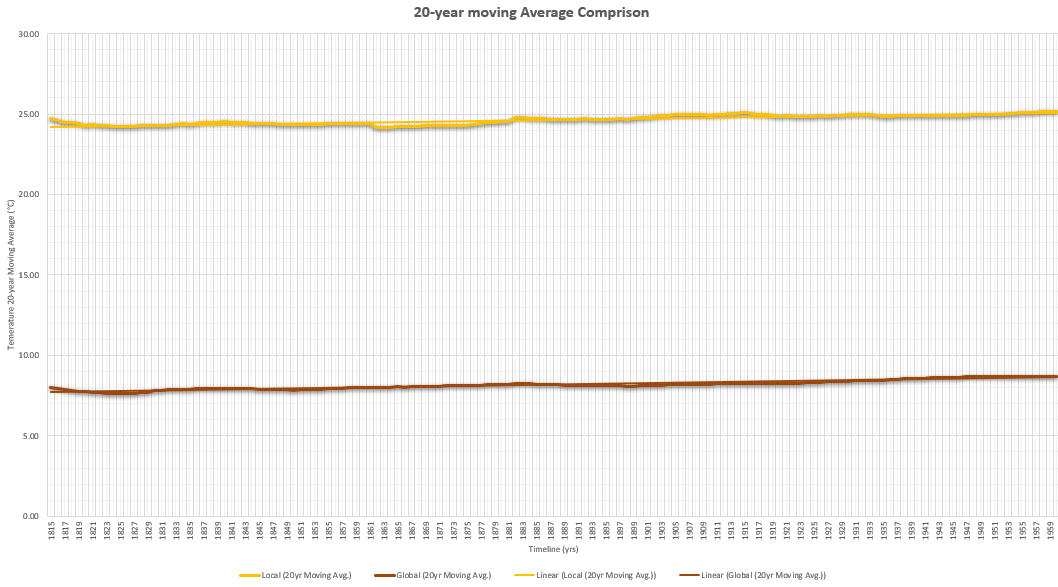
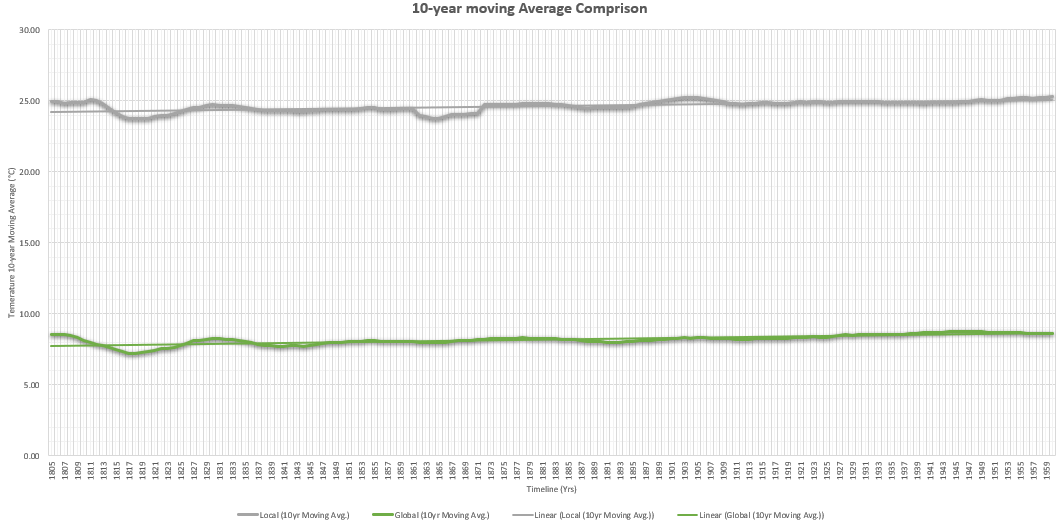
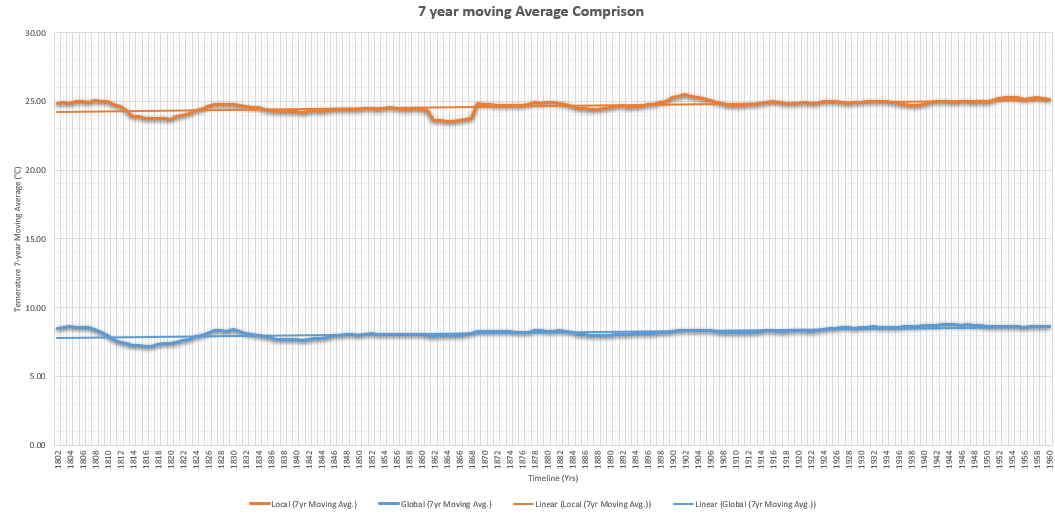
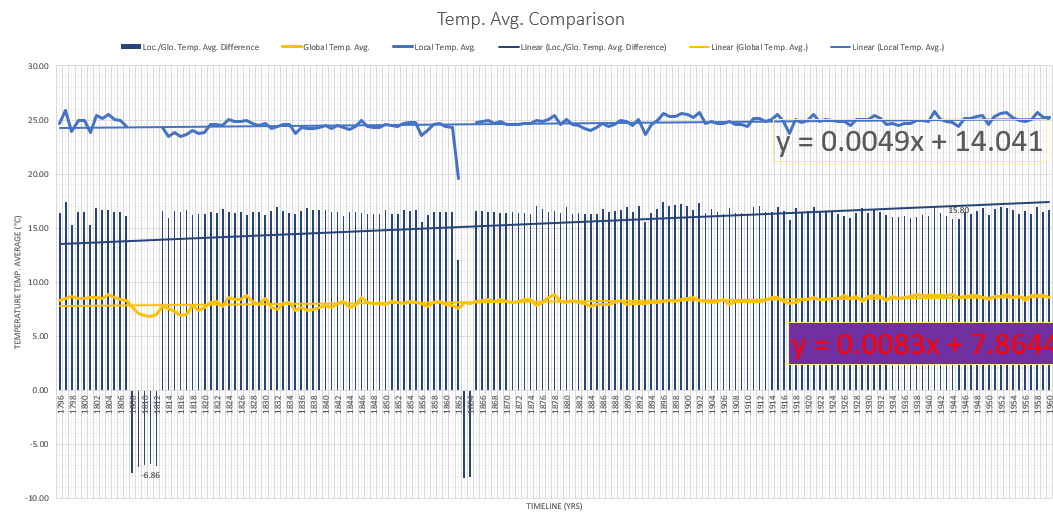
- Create a line chart that compares your city’s temperatures with the global temperatures. Make sure to plot the moving average rather than the yearly averages in order to smooth out the lines, making trends more observable (the last concept in the previous lesson goes over how to do this in a spreadsheet).
- Make observations about the similarities and differences between the world averages and your city’s averages, as well as overall trends. Here are some questions to get you started.
- Is your city hotter or cooler on average compared to the global average? Has the difference been consistent over time?
- “How do the changes in your city’s temperatures over time compare to the changes in the global average?”
- What does the overall trend look like? Is the world getting hotter or cooler? Has the trend been consistent over the last few hundred years?
Your submission should be a PDF that includes:
- An outline of steps taken to prepare the data to be visualized in the chart, such as:
- What tools did you use for each step? (Python, SQL, Excel, etc)
- How did you calculate the moving average?
- What were your key considerations when deciding how to visualize the trends?
- Line chart with local and global temperature trends
- At least four observations about the similarities and/or differences in the trends
This is an Udacity Nanodegree project.I was interested in using Weather Data to Answer Some Question Asked By Udacity:
- What tools did you use for each step? (Python, SQL, Excel, etc).
- How did you calculate the moving average?
- What were your key considerations when deciding how to visualize the trends?
Must give credit to Udacity for the data. You can find the Licensing for the data and other descriptive information at Udacity Website in Udacity Data Analyst Degree in Project I: Explore Weather Trends.