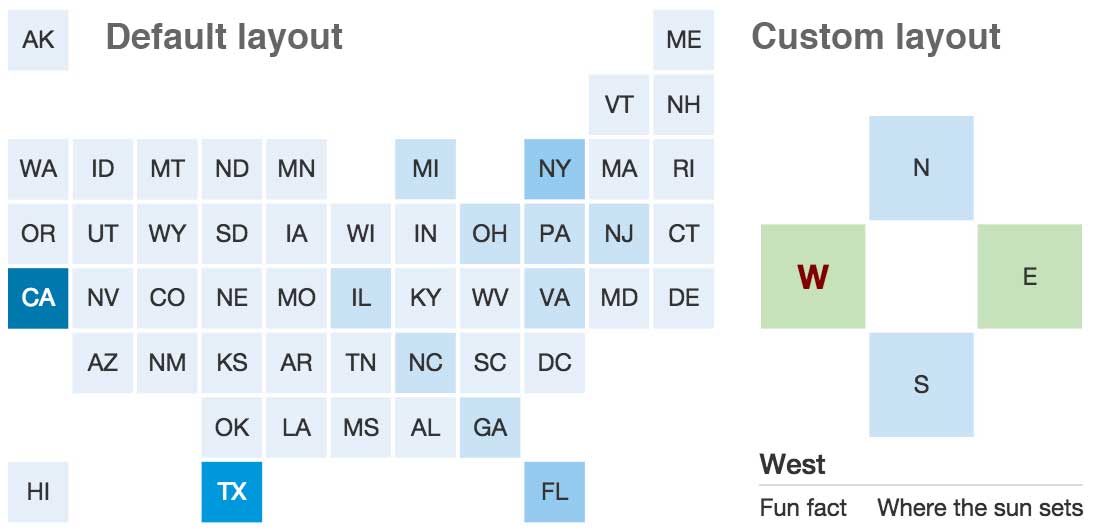
This is not a map. This is a table with strong visual cues.
- Quick start
- Methods
- Data
- Options (tooltips, breakpoints, layout, labels, colors)
- Advanced options (other layouts, active box)
- Philosophy (alternatives, related reading)
- Contributing
Squaire (pronounced square) is a javascript library to make responsive "maps" of equal-area squares.
- Squaire requires d3.js and includes a modified version of d3-tip for tooltips.
- Use SVG Crowbar to download the SVG and edit the chart in a vector application such as Adobe Illustrator.
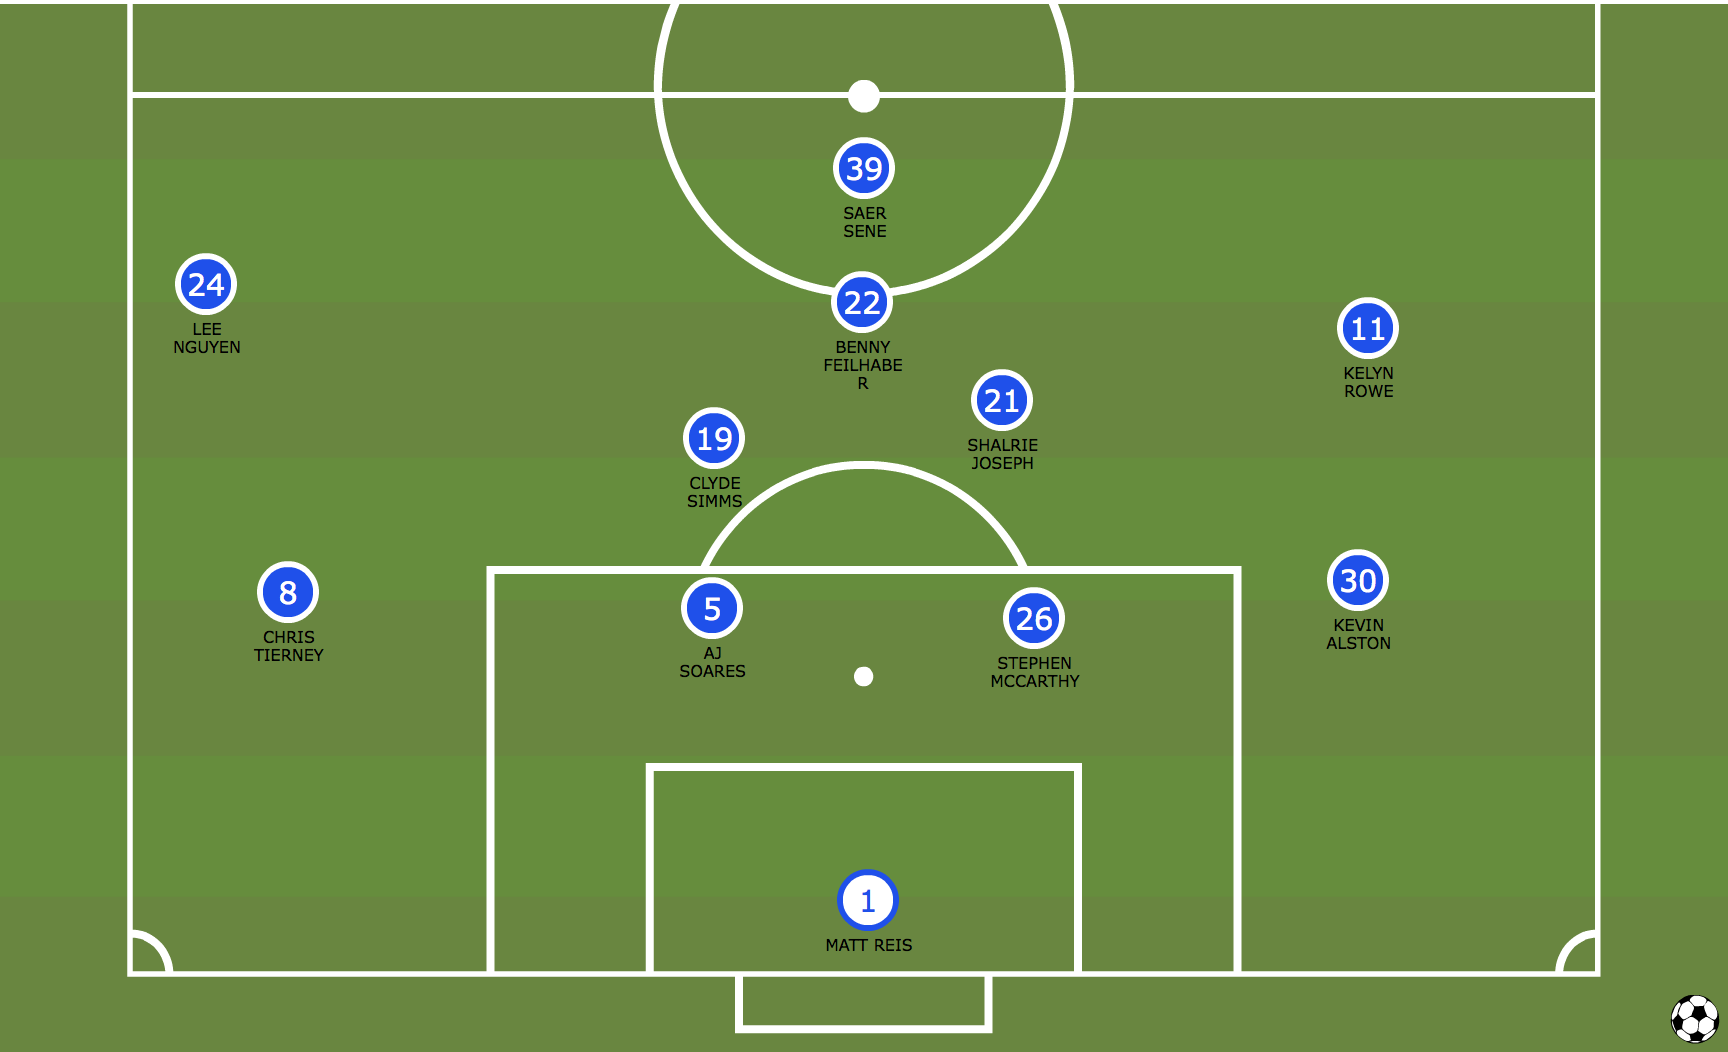
- The default layout and data labels are for the United States, but the library can be used to make any grid of squares with data, including countries in Europe, legislative districts in California and soccer starting lineup.
- Familiarity with d3.js will help in using this plugin, however the docs and
demo/include code samples for the small amount of d3 required to make a simple map.
Download the files in dist to your project directory and include d3.js, squaire.js (after d3.js) and squaire.css.
<link rel="stylesheet" href="squaire.css"/>
<script src="https://cdnjs.cloudflare.com/ajax/libs/d3/3.5.6/d3.min.js" charset="utf-8"></script>
<script src="squaire.js"></script>

<div id="map-container"></div>

<script type="text/javascript">
	var data = {
		"NY" : { "value": "$4" },
		"AL" : { "value": "$1" }
	};
	var map = new Squaire(data, {
		colors: d3.scale.quantize().domain([1,5]).range(['#c9e2f5','#0098db'])
	});
</script>var map = new Squaire(data, options);
No options are required to work, but you will want to set colors to see the map colored by data and index if data doesn't include a column named "value". Element selectors for the map container and static tooltip (if used) need to exist in the DOM already.
Call update(data, options) on a Squaire element to update the data, layout, data column used to color the boxes, the color scale and change the data displayed in the tooltip. Update can't enable or disable the tooltip, change the tooltip mode or either element.
If you only want to update options and not the data, pass false in place of data.
var map = new Squaire(data, options);

map.update(false, {
	index: index,
	colors: d3.scale.quantize().domain([1,5]).range(['#fdc47c','#d991b2'])
	whitelist: [index]
});Squaire takes a JSON object where each property name points to data for a box of the map. The property name maps to the ids in layout and labels in options. Squaire defaults to U.S. states and two-letter abbreviations for the id.
The value of each property is an object with property strings equivalent to column headers. Any column may be used to assign a class to boxes or a note to the tooltip.
Squaire.update may be used to update data directly, but if you only wish to change the data in view and coloring the boxes it is best practice to pass all the data to the constructor and use the index and tooltip options. The data object extends the layout so missing properties and data columns are handled properly.
Value properties are used as labels in the tooltip and thus should be formatted for display. Values should also be formatted for display, e.g., $5, -6.2%, 16 lbs. When indexType="numeric" (default), Squaire strips symbols of non-numerical symbols as necessary using d.replace(/[^\d-\.]/gi,'').
Data from a spreadsheet can be processed using Mr. Data Converter (output as JSON - Dictionary) or formatted from a tsv or csv file using d3.js parsing.
var data = {}, map, options;

d3.csv("path/to/file.csv", function(r){
	// write values to object using id as proprety name
	// id is the column name in the spreadsheet that maps to the layout and labels -- U.S. state two-letter abbreviations in default squaire.js settings
	data[r.id] = r;
	//remove id from dictionary values
	delete data[r.id].id;
	return r;
}, function(csv) {
	//callback when file loaded and data formatted
	map = new Squaire(data, options);
});
d3.csv and d3.tsv methods are interchangeable. They accept a url and optional accessor and callback functions (d3.csv(url[[, accessor], callback])). The accessor formats each row of data before calling the callback signaling the data is loaded and formatted. The code above uses the accessor to write the array properties to a dictionary object defined previously instead.
Setting options for constructor.
| property | type | default | description |
|---|---|---|---|
| el | string | "#map-container" | CSS selector for map parent element. |
| layout | array or string | U.S. state layout | Layout of boxes on the map. Array in the form of aRanger or tsv or csv string. See layout |
| labels | object | U.S. state full, AP style and two-letter | Object of label formats for boxes. See labels |
| labelStyle | string | "short" | Large breakpoint label format for boxes defined in labels. Required options are "full" (Alabama) and "short" (AL). Default layout and labels includes "ap" too. See labels |
| index | string | "value" | Name of column in data used to color boxes. |
| indexType | string | "numeric" | How data coloring boxes should be treated. "numeric" for linear and quantitative scales or "string" for ordinal scales. For "numeric," type of data may still be strings with unit labels. |
| colors | function | d3.scale.ordinal().range(['#f3f3f3']) | d3.js color scale for boxes. See colors |
| classIndex | string | false | Optional name of column with values to be assigned as classes to each box. |
| defaultColor | string | "#f3f3f3" | Color for boxes with undefined data. |
| tooltip | object | {...} | Tooltip options. See tooltips |
| breakpoints | object | {...} | Breakpoints. See breakpoints |
| property | type | default | description |
|---|---|---|---|
| enabled | boolean | false | Set to true to enable tooltips. |
| mode | string | "dynamic" | "dynamic" (tooltip next to box on hover), "static" (tooltip data in static HTML element outside map), "toggle" ("dynamic" above small 540px breakpoint, "static" below) |
| el | string | ".squaire-toolbox" | CSS selector for static tooltip (used with "static" and "toggle" modes) |
| layout | function | false (default layout in constructor) | function (d) {...} to write HTML to tooltip. |
| whitelist | array or string | "*" | Array of column names to show in tooltip. Default "*" selects all columns. |
| column1 | string | "" | Label for property column in tooltip table of data. |
| column2 | string | "" | Label for value column in tooltip table of data. |
| noteIndex | string | false | Name of column with additional text to append at the bottom of tooltip (e.g., footnote). Text may be styled via .tooltip-note. |
A Squaire instance is responsive to its container (el). The breakpoint names are applied to the square container via a data-breakpoint attribute.
small is the primary breakpoint where labels change to short and the tooltip toggles between static and dynamic. It is the only breakpoint used in squaire.js beyond assigning the attribute to the container.
| property | type | default | description |
|---|---|---|---|
| "small-thumbnail" | int | 270 | Referenced by CSS (labels are hidden, possible use for thumbnails or icon). Considered small for breakpoints referenced in squaire.js. |
| "small-xsmall" | int | 350 | Referenced by CSS (smaller labels). Considered small for breakpoints referenced in squaire.js. |
| "small" | int | 540 | Primary breakpoint where labels change to short and the tooltip toggles between static and dynamic. |
| "medium" | int | 940 | Referenced by CSS (larger labels). |
| "large" | int | "" | Referenced by CSS. |
The layout of the boxes can be in one of two formats. You will probably want to edit the breakpoints if you change the layout or labels.
Code for a custom layout and labels.
Make a custom layout using MinnPost's aRanger to move around the boxes. The tool is preloaded with data for U.S. states and makes the array.
Each box in the array is a triplet, [x,y,id] of location data and the box id (string, e.g., "NY") on a chart where the top-left corner is [0,0] and each box is 1.
Use a spreadsheet to make the layout where each cell starting at A1 is a box in a Squaire map. Enter the box label, e.g., NY, in the cell. The resulting tab-separated or comma-separated data can be used as the layout.
See other layouts for more information on non-U.S. state maps and an example.
Layout format and parser from Squared.
Overwrite Squaire.prototype.prepareData(layout, data) to process a custom layout format and return an array with an object for each box in the following format:
[{
	x: 8, //horizontal position of box (0 is the left edge)
	y: 2, //vertical position of box (0 is the top edge)
	box: 'NY', //string connecting box and label. U.S. state two-letter abbreviations in default settings.
	data: {...} //data for the box
}]Object defining label formats for Squaire boxes. Properties of the object map to properties in data and layout.
Required format types are "full" (used in default tooltip) and "short" (used for the small breakpoint). Default label object includes AP style "ap" for U.S. states and is only used if labelStyle is set to "ap".
"AL" : {
	"full"  : "Alabama", //used in tooltip (required)
	"short" : "AL", //used in small breakpoint (required)
	"ap"    : "Ala." //optional label format included in default labels and recommended for `labelStyle` for U.S. states. May be excluded or renamed as the only reference to the format would be from the user-defined "labelStyle" option.
}
Code for a custom layout and labels.
Color scales are complicated. That's why Squaire leaves it to the professionals, a.k.a., d3.js. The range is an array of color hex strings.
If you're not fluent in d3 color scales, below are some examples to get you started. Use quantitative scales for numeric data (values may include labels) and ordinal for categorical data where a string should map to a color.
If you are testing a quantitative scale, use scale.invertExtent('range value') to see the range of domain values that map to the range. In the return array, the max value is exclusive, e.g., [0,1] means 0 and .99 return the given range value, but 1 does not.
Set indexType: "numeric". Range values should be hex strings for Squaire. Color names used for example only.
Divide the domain of data values (given by a max and min) into equal buckets where each color represents the same size range of values.
//quantize divides [min,max] of domain by length of range to make buckets
var quantize = d3.scale.quantize()
	.domain([0,100])
	.range(["yellow","orange","red"]);

console.log( quantize(0), quantize(33), quantize(34), quantize(90) );
//output: yellow yellow orange red
quantize.invertExtent("yellow")
//output: [0, 33.333333333333336]Set indexType: "numeric". Range values should be hex strings for Squaire. Color names used for example only.
Divide the full array of data values into equal-length buckets where each color maps to the same number of values.
//quantile groups values into equal-length buckets, e.g., smallest third, middle third, largest third
var quantile = d3.scale.quantile()
	.domain([0,1,5,50,51,100])
	.range(["yellow","orange","red"]);

console.log( quantile(0), quantile(1), quantile(5), quantile(50), quantile(51) );
//output: yellow yellow orange orange red
quantile.invertExtent("yellow")
//output: [0, 3.666666666666666]
quantile.invertExtent("red")
//output: [50.333333333333336, 100]Set indexType: "numeric". Range values should be hex strings for Squaire. Color names used for example only.
Divide the domain of data values into custom irregular buckets where each color represents a custom size range of values.
//threshold converts domain values into buckets where the max value is excluded.
var threshold = d3.scale.threshold()
	.domain([0,1,5,50])
	.range(["less than 0","yellow","orange","red"]);

console.log( threshold(0), threshold(1), threshold(5), threshold(49), threshold(50) );
//output: yellow orange red red undefined
threshold.invertExtent("yellow")
//output: [0, 1]
threshold.invertExtent("red")
//output: [5, 50]Set indexType: "string". Range values should be hex strings for Squaire. Color names used for example only.
Map a string domain value directly to a range color.
var ordinal = d3.scale.ordinal()
    .domain(["small", "medium", "large"])
    .range(["yellow","orange","red"]);

console.log( ordinal("small") );
//output: yellowAfter loading squaire.js, you can overwrite methods for special use cases. Browse the source code to see all the methods, e.g., Squaire.prototype.mapInteraction() where events are bound to the boxes.
To make a map or any graphic with a box grid other than U.S. states, pass a new layout array or string and labels object. You will likely want to edit the breakpoints too.
Each box needs a unique string to connect the data, layout and labels.
var labels = {
	"N" : {
		"full"  : "North", //used in tooltip
		"short" : "N", //used in small breakpoint
		"ap"    : "N" //label format used in larger breakpoints. Can be renamed from "ap" if option `labelStyle` is changed to match or not included if `labelStyle` is set to "full" or "short".
	},
	"E" : {
		"full"  : "East",
		"short" : "E"
	},
	"S" : {
		"full"  : "South",
		"short" : "S"
	},
	"W" : {
		"full"  : "West",
		"short" : "W"
	}
}

var data = {
	"N" : { "value": "longitude" },
	"E" : { "value": "latitude" },
	"S" : { "value": "longitude" },
	"W" : { "value": "latitude" }
};

var map = new Squaire(data, {
	layout: ",N,\nW,,E\n,S,",
	labels: labels,
	labelStyle: "full",
	colors: d3.scale.ordinal(["longitude","latitude"]).range(["#c9e2f5","#c6e2ba"]),
	indexType: "string"
});
See data and layout for more information on formatting.
.active is applied to the <g> element (box) in focus via mouseover. The element is also moved to the front.
Squaire aims to be an extendable base to cover 90% of uses of square bin maps online. The tables are responsive and easily adopted for print use via downloading the SVG. Using d3.js makes the base extendable for advanced uses and keeps colors separate. Tooltips add an additional level of data. Prototypical inheritance makes it easier to extend parts of the library without editing the source code. Legends and colors are separate from the tool as these vary greatly depending on the user and data.
If Squaire seems like overkill to you or you only need an image or simple static representation of the map, keep reading.
Squaire may be overkill for your needs, and it certainly isn't the first of its kind. Check out these other tools and people making charts with squares:
- Squared.js: Quick and lightweight script to make any box layout in HTML. It doesn't handle data directly. Apply classes which you style color in your CSS. Good for static visuals with short labels. Rendering in HTML means no SVG download for advanced styling.
- stateblocks:
The Marshall Project's tool. Code unknown. Seems to make
<div>s and apply styles directly. Result is not responsive (yet). - statebins: R plugin to make an image in R. Examples are of U.S. state maps.
- Various layouts of square states in a U.S. map.
- Format spreadsheet data into JSON and Squaire-friendly data using Mr. Data Converter.
- Make a new layout with MinnPost's aRanger.
Pull requests are welcome and I will do my best to stay on top of them. However, I may not have time to carefully consider and test every contribution, so please do your best to test code changes and include what you did, what it changed and why you did it.
Squaire uses Grunt to compile files for distribution and publish the demo on github pages. If you wish to contribute, please use Grunt to compile edits to the source files. (Get started with Node.js and Grunt.)
grunt watch : Watch the files in src for a change. On change, compile the files into dist/ (build) and move a copy to demo/ (demo).
grunt publish : demo and push demo/ to gh-pages.
v0.5.0
- Initial release