Simple R library to plot matrices
This is a student project created for plotting matrices. This package makes use of the ggplot2 R package. This is inspired by the waffle package by hrbrmstr.
To install, please run devtools::install_github('adhok/plotmatrix')
data_matrix <- data.frame(a=c(1,0,0),b=c(0,1,0),c=c(0,0,1))
plotmatrix(data_matrix,legend_position="none")

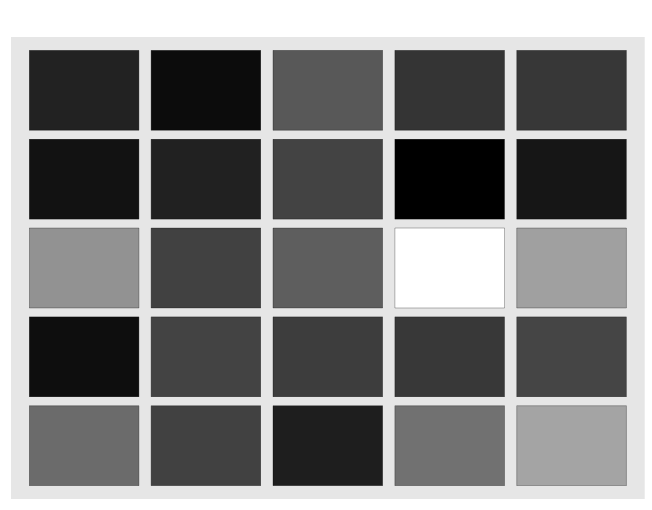
data_mat <- data.frame(a=rnorm(5),b=rnorm(5),c=rnorm(5),d=rnorm(5),e=rnorm(5))
1 -0.6263626 -1.1442027911  0.3078383 -0.2640656 -0.21058032
2 -0.9887316 -0.6361486806 -0.0109211 -1.2667987 -0.89614861
3  1.0713024 -0.0490916700  0.3915213  2.2195224  1.24336632
4 -1.1091824  0.0005946358 -0.1127620 -0.2016300  0.01867768
5  0.5793194 -0.0534150915 -0.7101341  0.6496321  1.28138064
plotmatrix::plotmatrix(data_mat,high_color = "#ffffff",low_color = "#000000",legend_position ="none")