A solution for determining the most optimal placement of location-based information maps throughout Toronto. Third place project at HackOn(Data) 2016.
- A Detailed Report of Our Third-Place Solution
- Danny's Blog Post on Our Experience at HackOn(Data) 2016
Chris Goldsworthy: Chris is a third-year undergraduate Computer Science student at the University of Toronto. He has an interest in machine learning and will be focusing on ML for the remainder of his undergraduate education.
Danny Luo: Danny is a third-year undergraduate Math and Physics student at the University of Toronto. He has a growing interest in data science and is actively teaching himself about the field.
Ryan Garnett: Ryan is a geographist who works for the City, specializing in curating and using geospatial datasets.
The City of Toronto wants to place digital billboard maps throughout the city in order to indicate landmarks or attractions within a certain area surrounding the map (i.e. a five minute walking radius). Therefore, it is important to determine what the most optimal placement of the billboard maps is, as well as determining which maps are more valuable compared to other maps (i.e. ranking them based off their importance).
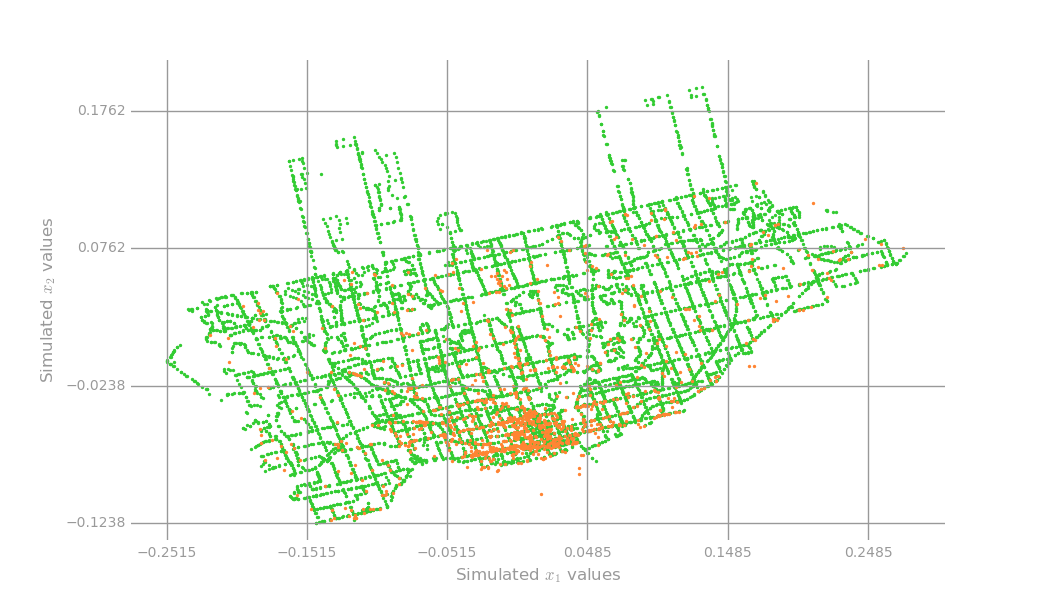
We were first given the cultural landmark dataset, which consists of properties labelled by the city as being availabe for use for any kind of cultural event (below: cultural landmarks in orange, transit stops in green for reference).
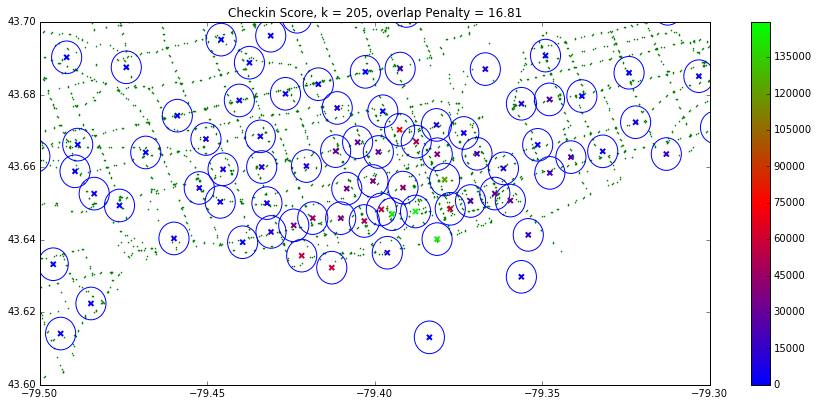
Therefore, our initial idea was that we should seek to cluster cultural landmarks together. The centroid of each cluster could then be an approximate location for placing a billboard map. K - Means lends itself to the task very well. One question however is how many centroids should be chosen. We decided to frame this in terms of a cost problem: we should aim to maximize K to find the best placement of signs, whilst setting a threshold for maximum area overlap for all signs to prevent redundancy. The threshold can be chosen arbitrarily and is something that a city will need to consider when trying to deploy the billboard maps.

Next, we wanted to determine which areas signs are the most valuable and rank them accordingly. There are several ways to determine which signs are the most valuable, but intuitively, it can be framed as areas with:
- The highest volume of people participating in cultural activities (cultural popularity)
- The most cultural landmarks
- The highest degree of accessibility (which we framed in terms of accessibility by public transport)
After framing the problem this way, each sign can receive a score for each criteria above:
- We can compute a score for cultural popularity by computing the number of Foursquare checkins (to cultural venues) within the area surrounding the sign (i.e. five minutes walk radius)
- To see which area has the most cultural landmarks, we simply sum the number of landmarks in the area surrounding a sign
- To determine which areas are most accesiable by public transport, we sum the number of transit stops in the area the sign covers
To compute these scores, we first mined checkin data off of Foursquare using a grid search, resulting in the data below:

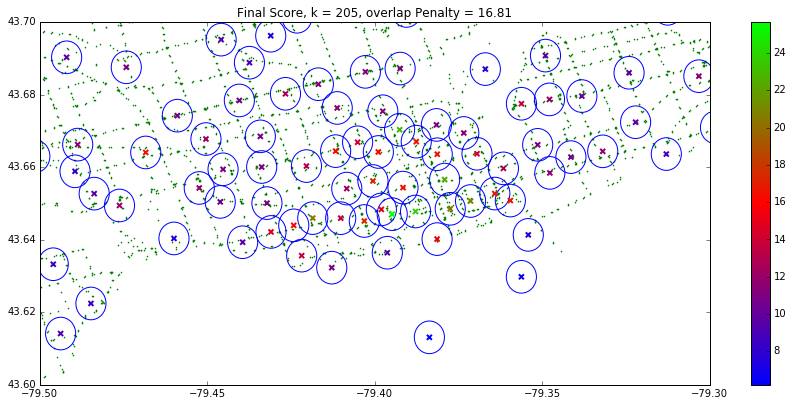
Finally, we can compute the scores of each area using the individual scores, or using a weighted sum of them ("Final Score").
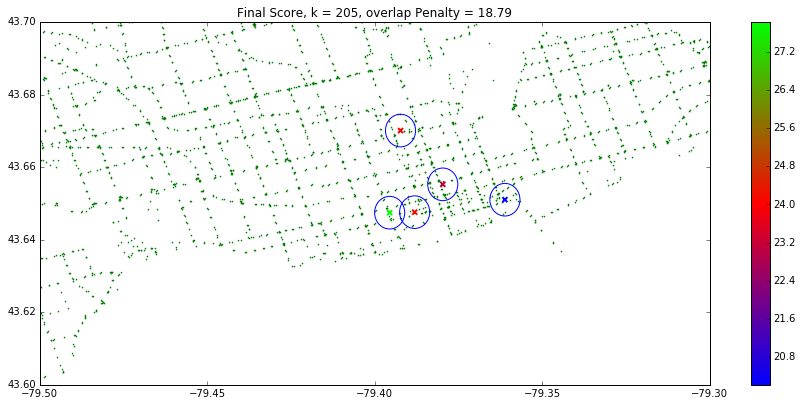
The top five of these signs using the weighted score can be seen below:
The code used to create some of these images, as well as mining data off of Foursquare, can be found here.
The code used to compute the location and ranking of the signs can be found in the repository.