The covid-19 pandemic has affected the education system. Daily progress monitoring of student’s performance that was so prevalent in the offline method of teaching has been hampered due to the unavailability of class interaction and personal attention.
Edcautional Institutions across the globe were closed due to pandemic and over 1.2 billion children were no longer in the classroom. Many education systems adopted online learning.
The online platforms introduces discussion forums where teachers can ask questions to check student’s attentiveness and performance. We used transcripts of discussion forums to monitor and study the participation of students.
• Data was collected in multiple .txt files which were then converted into flat files and merged into a single dataset for analysis.
• Dataset has three columns - Timestamp of reply, Name of student, and content of the chat but analyzing categorical data was challenging.
• Data cleaning was a rigorous task where we fixed misspelled words, abbreviations etc.
• In data exploration, we used data visualization methods such as graphs, histograms, etc to analyze responses between the student’s across different sessions more simply and effectively. Libraries like NLTK were used to find stopwords, most commonly used words, etc.
• Provided detailed analysis of the students’ performance like daily attendance, daily response, number of correct responses, number of questions asked by the teacher in each session, number of responses to each question, etc. in Tableau.

By noting the number of questions asked by the faculty we can keep track of how often the teacher challenges their students in class by using the chat window to ask questions frequently.

Factors such as the total number of responses in a lecture, number of responses for each question, and number of responses by each student give a qualitative and quantitative study of the eagerness of both the class as a whole and its individual student.

Finding most frequrntly used keywords and phrases in a chat can help teachers understand which the topics need reinforcement and revision, making the entire
learning process efficient. In session-2 Example was used most frequently inferring, the teacher encourages students to explain answers with an example.

On the left-hand side, plot displays the most frequently used words with stopwords and on the right-hand side, plot displays the most frequently used words without stopwords

The number of responses to a question was higher at the starting of sessions. This means that students answered questions asked earlier on more frequently. A maximum of 37 responses were recorded after the first question of session 2. Another observation made was that the number of responses started decreasing as the number of sessions increased, implying that students were participating less as the course progressed.

The graph in LHS of the above figure displays the number of questions asked by the teacher in all the sessions and their respective responses are displayed in RHS.

The graph in the above figure displays the results of Session-2 and Session-7. We added a filter that is visible on the RHS of the graph, through which a teacher can easily look at the participation of students for a specific session and can even compare between different sessions. Using this figure, we can analyse that the number of questions asked by the teacher in Session-1 was 3 and their respective responses were 26 while the number of questions asked by the teacher in the discussion forum was 1 and the respective responses were 3. Using the above information, teachers can make decisions on which topic to reinforce more deeply in upcoming lectures on the basis of past responses.

The horizontal bar graph in the above figure displays the number of responses of each student across all the sessions. The y-axis shows the session number and name of the student who responded to those sessions and the x-axis shows the count of responses. The Figure displays only two sessions but the dashboard can be scrolled down to view the responses to all the sessions.

The horizontal bar graph in the above figure displays the number of responses of Student-1 across all the sessions. We have added two filters to this dashboard where a teacher can see the number of responses of a specific student in a specific session if needed. In this graph, we used the first filter to show the results of only Student-1.
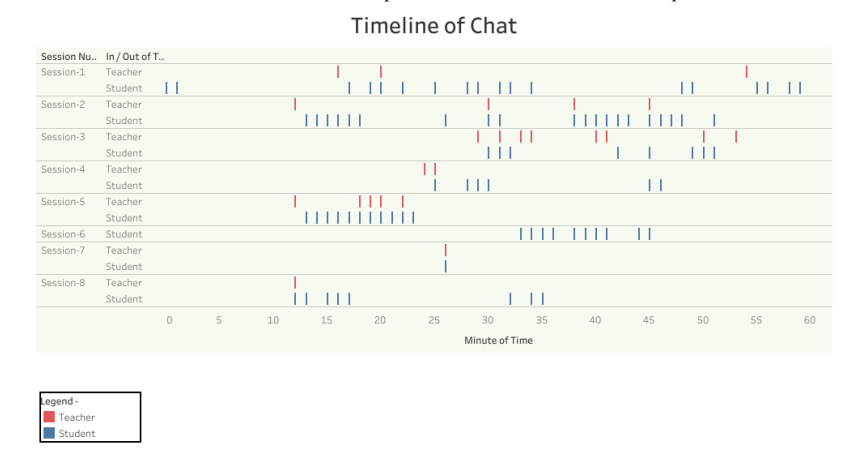
The graph in the above figure displays the timeline of the chats in each lecture. The first column displays the session number and the second column displays the participants whether teacher or student, the red bars represent the time in minutes from the starting of class when the teacher asks questions in the forum and the blue bars represent the responses of students with their time after starting the session. From the graph, the teacher can analyze that in Session-2 there were quick responses after each question asked because there are continuous blue lines i.e. student's responses after a red line i.e teacher's question in Session-2
From many studies we found that many students lack interest in these traditional chat-based forums due to the unavailability of modern aesthetics present in social media platforms. We have suggested our school to add features like image upload, upvote options, and filters which may increase the enthusiasm of students to participate in forums.