Panels Buttons
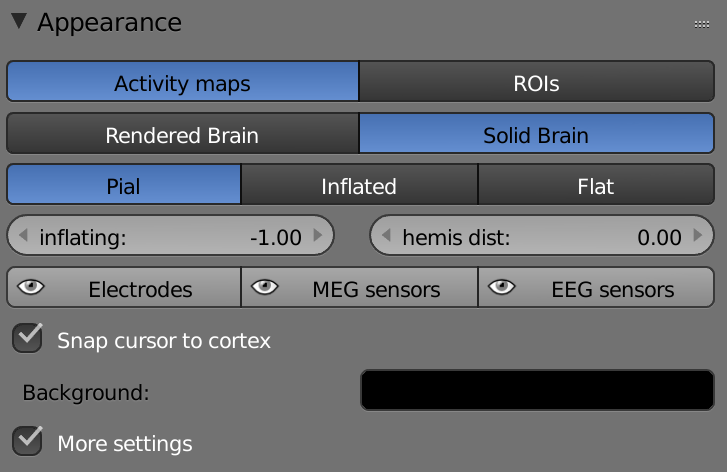
Appearance
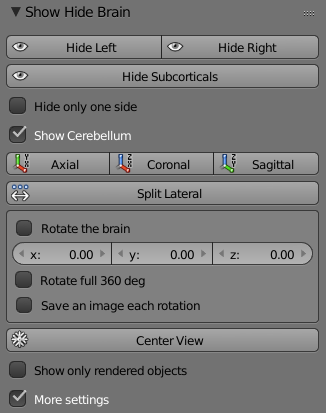
Show Hide Brain
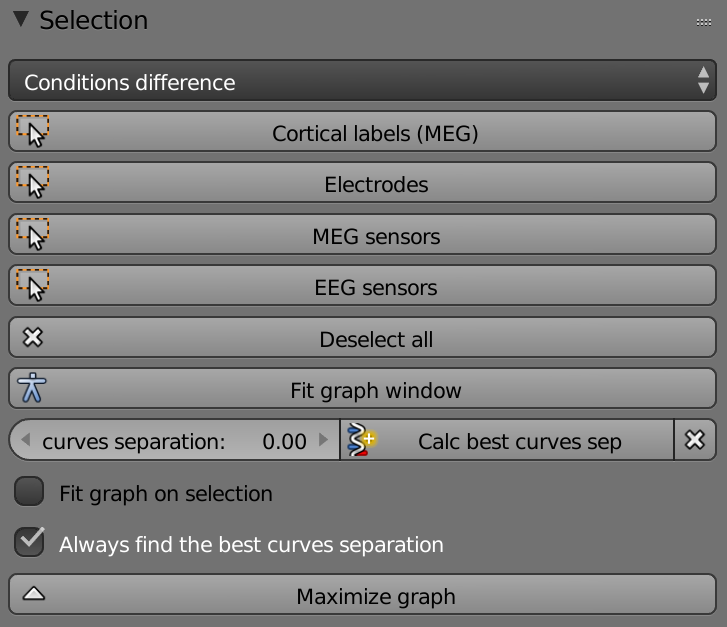
Selection
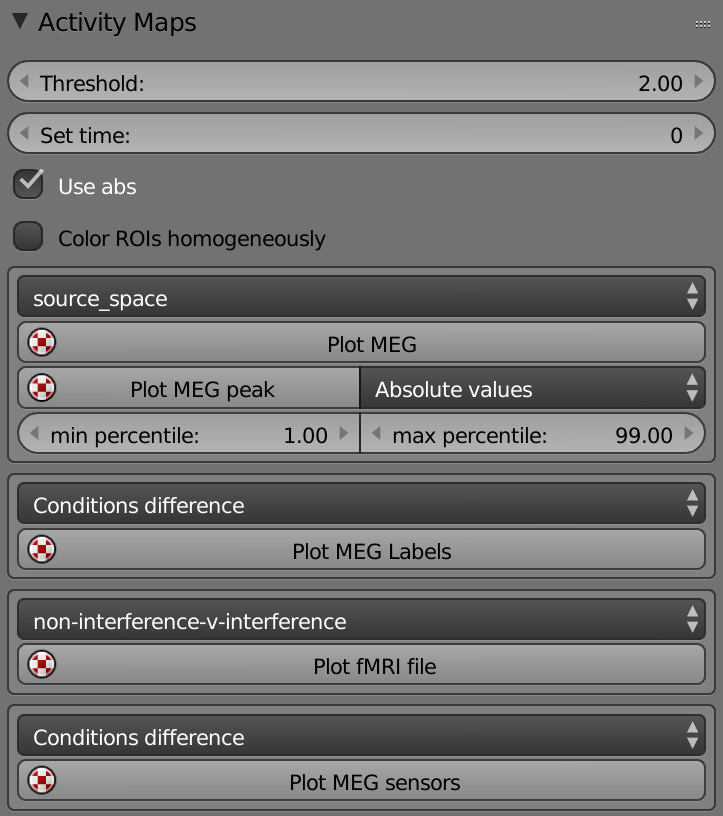
Activity Maps
Colorbar
fMRI
Where am I
Play
Filter Number of Curves
Freeview
Render
Search Panel
Load Results
Transparency
Data in Vertex
Slicer
Cortical Labels
Scripts
Stream
Electrodes
Import Objects and Data
-
Activity maps – The whole brain is one object.
-
ROIs – Each label is a separate object.
-
Rendered Brain – Rendered view of the brain (including transparency and light).
-
Solid Brain –
-
Pial – Pial brain view.
-
Inflated – Inflated brain view.
-
Flat – Flat brain view.
-
Inflating – Sets the value between Pial view (value = -1.00), Inflated view (value = 0.00) and Flat view (value = 1.00).
-
Hemis Dist – Sets the distance value between the hemispheres.
-
Electrodes – Show/Hide electrodes.
-
MEG sensors - Show/Hide MEG sensors.
-
EEG sensors - Show/Hide EEG sensors.
-
Snap Cursor to Cortex – The cross stays on the cortex when clicked.
-
Background – Changes the background of the brain display section.
-
Hide Left – Hide/Show left hemisphere.
-
Hide Right - Hide/Show right hemisphere.
-
Hide Subcorticals - Hide/Show subcortical region.
-
Hide Only One Side – Changes the ‘Hide Subcorticals’ button into two buttons which Hide/Show left or right side of the subcortical region.
-
Hide Cerebellum - Hide/Show the cerebellum.
-
Axial – Moves the brain to an Axial view.
-
Coronal - Moves the brain to a Coronal view.
-
Sagittal - Moves the brain to a Sagittal view.
-
Split Lateral – Splits the hemispheres into lateral view.
After pressing the button changes into:
Split Medial – Turns the hemispheres into medial view.
After pressing the button changes into:
Normal View - Changes the brain back to regular view.
-
Rotate The Brain – When the box is checked the brain starts to rotate according the values that were set to the x,y,x axis below the check box.
-
X,Y,Z– Sets the value of the x,y,z axis for the brain rotation (The brain rotation starts after checking the ‘Rotate The Brain’ check box).
-
Rotate Full 360 deg - Rotates the brain 360 deg and stops when done.
-
Save an Image Each Rotation – Saves an image each rotation according the values that were set to the x,y,x axis below the check box. The pictures are saved inside the ‘figures’ folder under the subjects’ name folder.
Example: ..\ mmvt\mmvt_root\mmvt_blend\colin27\figures -
Center View – Moves the brain back to the center of the window.
-
Show Only Rendered Objects – Removes the crosshairs and other descriptive markers.
-
List (Conditions) – Selects the condition that will be displayed.
-
Cortical Labels – Selects all ROIs.
-
Electrodes – Selects all the electrodes to show their data.
-
MEG Sensors – Selects all the MEG sensors to show their data.
-
EEG Sensors - Selects all the EEG sensors to show their data.
-
Deselect All – Deselects all the selected data.
-
Fit Graph Window – Scales the graph to fit the window optimally.
-
Curves Separation – Separates the curves in the graph
-
Calc Best Curves Separation – Separates automatically the best distance between the curves in the graph.
-
X – Restarts the curves separation.
-
Fit Graph on Selection - Scales optimally the graph upon selection.
-
Always Find the Best Curves Separation – When checked separates automatically the best distance between the curves in the graph.
-
Maximize Graph – Fits the graph to the whole window (hides brain view).
-
Minimize Graph – Resizes the graph back to the original size.

-
Threshold – Sets the threshold to plot the activity.
-
Set Time – Sets the time to plot the activity.
-
Use abs – Plots only the activity with an absolute value above the threshold.
-
Color ROIs Homogeneously – Plots each cortical ROI as an object.
MEG
-
List (Conditions) – Selects the condition to plot the MEG activity.
-
Plot MEG - Plots MEG activity.
-
Plot MEG Peak - Displays the time and location with the highest peak.
-
Plot MEG Peak Options list -
Absolute Peak – Finds the absolute peak.
Positive Peak – Finds the positive peak.
Negative Peak - Finds the negative peak.
-
Min - Max Percentile – Sets the percentiles that are being used to calculate the min & max colorbar’s values.
-
List (Conditions) – Selects the condition to plot the MEG labels activity.
MEG Labels
-
Plot MEG Labels – Plots the MEG Labels activity according the selected condition.
-
List (Contrasts) – Selects the contrast to plot the fMRI activity.
fMRI
-
Plot fMRI File – Plots the fMRI activity according the selected condition.
-
List (Conditions) – Selects the condition to plot the MEG sensors activity.
MEG Sensors
-
Plot MEG Sensors – Plots the MEG sensors activity according the selected condition.
-
List (Conditions) – Selects the condition to plot the EEG sensors activity.
EEG Sensors
-
Plot EEG sensors – Plots the EEG sensors activity according the selected condition.
-
List (Conditions) – Selects the condition to plot the electrodes activity.
Electrodes
-
Plot Electrodes – Plots the electrodes activity according the selected condition.
-
Min - Max Percentile – Sets the percentiles that are being used to calculate the min & max colorbar’s values.
Connectivity
-
Plot Connections – Plots the connections value.
-
Hide Connections Under Threshold – Hides the connections under the threshold.
Connectivity Degree
-
List – Connectivity degree files.
-
Threshold – Sets the connectivity degree threshold.
-
Use Connectivity Absolute Value - Sets the connectivity degree threshold according to absolute value.
Color Manually
-
List (files) – Selects the file to color manually.
-
Color Manually – Colors according the selected file.
-
Plot Labels as Contour – Plots the labels as contours only.
-
Plot a Label – Plots label files of MNE type.
-
Clear – Clears all the plotted activity.
-
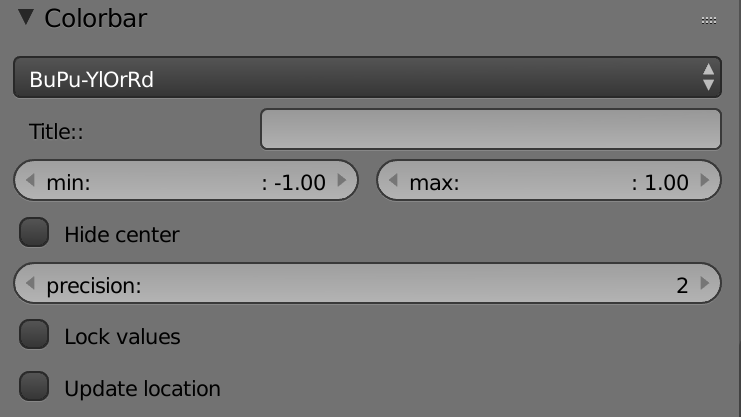
List (Palettes) – Selects the colorbar color palette.
-
Title – Renames the colorbar's title in the display area.
-
Min – Sets the minimum value of the colorbar.
-
Max – Sets the maximum value of the colorbar.
-
Hide Center – Hides the center of the colorbar.
-
Precision – Sets the number of the decimal places in the colorbar.
-
Lock Values – Locks the colorbar values.
-
Update Location – Centers the colorbar position in the display area.

-
List (Contrast) – Selects the contrast for the cluster analysis.
-
List of Clusters – Displays a list of clusters. The list can be sorted and refined by the parameters below. Each cluster can be chosen to show detailed information below.
-
Sort – Sorts the clusters list by either t-value, size or name.
-
Refine Clusters – Opens further options to refine the clusters list.
-
Clusters t-val Threshold – Sets the threshold for the t-value to sort the clusters list.
-
Clusters size Threshold – Sets the threshold for the size to sort the clusters list.
-
Starts With – Finds clusters by name or the few first letters that their name starts with.
-
Left Hemisphere – Shows only the clusters in the list from the left hemisphere.
-
Right Hemisphere – Shows only the clusters in the list from the Right hemisphere.
-
Only with Electrodes – Shows only clusters with electrodes.
-
Plot Clusters Contours – Plots the label contours of the selected clusters.
Color pallet - Sets the color to plot the labels contours.
-
Listen to Left Clicks – Finds and selects the closest cluster to the cursor each time left mouse clicked.
-
Plot all Blobs – Plots all the clusters in the list.
-
Nearest Cluster – Finds the closest cluster to the cursor.
-
Load volume fMRI file – Pre-process fMRI data using Free Surfer.
-
Clear – Clears all the plotted clusters.
-
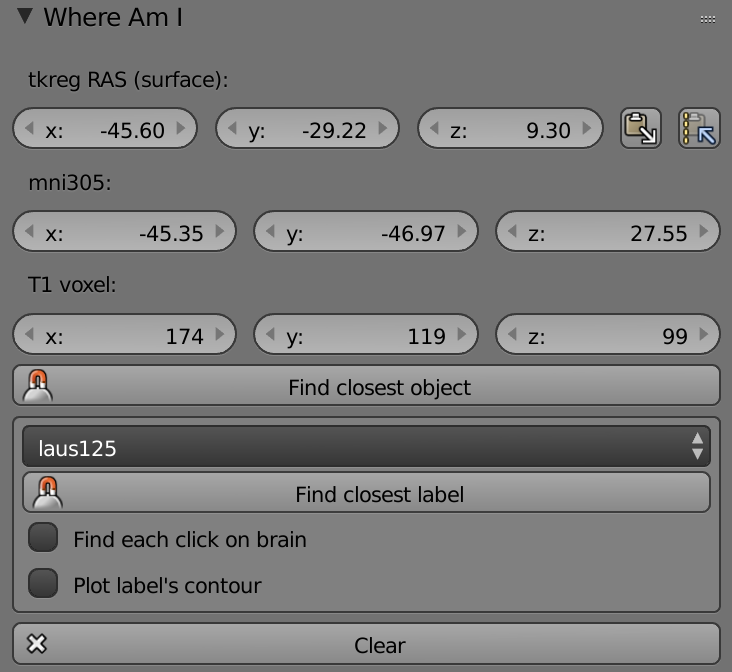
Tkreg Ras (Surface) – Sets the cursor according to Free Surfers x, y, z tkreg coordinates.
-
Mni305 - Sets the cursor according to x, y, z tmni305 coordinates (same as RAS coordinates in Free Surfer).
-
T1 Voxel - Sets the cursor according to x, y, z T1 Voxel coordinates.
-
Text Line – Shows the name of atlas in use.
-
Find Closest Object – Finds the closest object to the cursor.
-
List (Atlas) – List of different atlases.
-
Find Closest Label – Finds the closest label to the cursor according to the chosen atlas above.
-
Find Each Click on Brain – Finds the closest label each time an area clicked (right click) on the brain.
-
Plot labels Contour – Plots the selected label’s contour.
-
Clear – Clears all the plotted labels.

-
From – Sets the starting time point of the activity.
-
To – Sets the ending time point of the activity.
-
Dt – Transition.
-
List (Modality) – Chooses the displayed modality.
-
Play Buttons
-
Render to a Movie – Renders each frame.
-
Save Images – Saves the played images in the subject’s ‘movies’ folder. Example: ..mmvt_root/mmvt_blend/colin27/movies
-
Rotate the Brain While Playing – Rotates the brain while playing according to the x,y,z axis set bellow.
-
X,Y,Z – Sets each rotation axis.
-
Create Movie – Concatenates the frames into a video.
-
Frames Per Second – Sets the frames per second for the video.
-
List (Conditions) - Selects the condition that will be displayed.
-
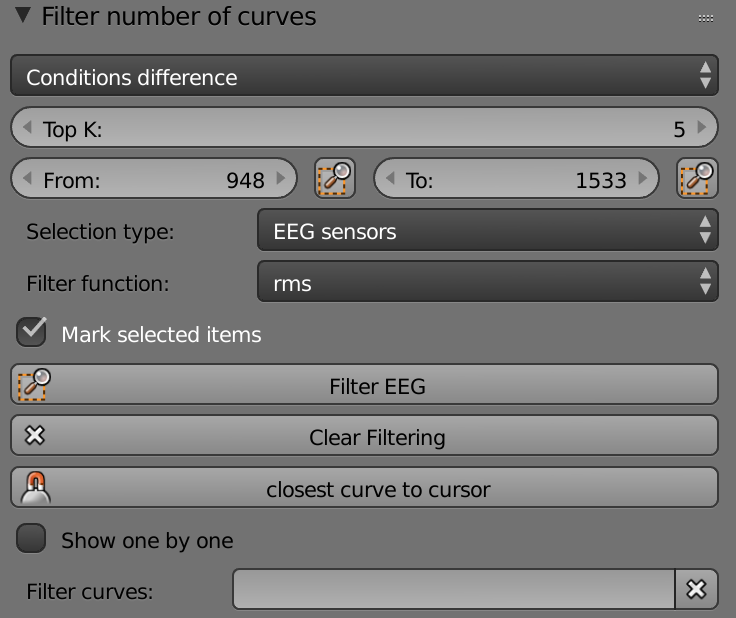
Top K – Sets the top curves number.
-
From – Sets the starting time point of the activity.
-
To – Sets the ending time point of the activity.
-
Selection Type – List of modalities.
-
Filter Function - List of functions.
-
Mark Selected Items - Shows the filtered objects on the brain.
-
Filter ___ - Filters the modality according the preferences set above.
-
Clear Filtering – Clears the filtered curves
-
Closest Curve to Cursor – Shows the name of the closest curve to the cursor below the button.
-
Show One by One – Shows each curve separately.
-
List (Curves) – List of the filtered curves.
-
Filter Curves – Filters curves by name or first letters.
-
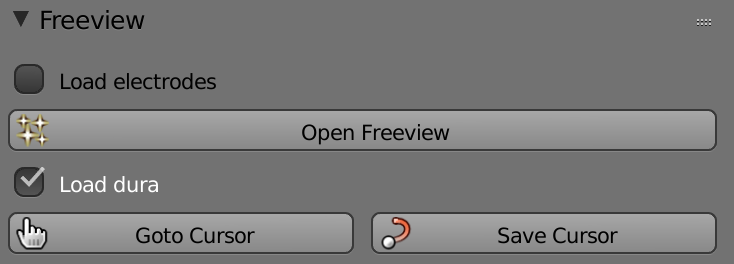
Load fMRI – Loads the volumetric fMRI data into Freeview.
-
Load Electrodes - Loads the electrodes coordinates into Freeview.
-
Load Pial - Loads the pial surface data into Freeview.
-
Load Dura - Loads the dura surface into Freeview.
-
Open Freeview – Opens Freeview.
-
Goto Cursor – Changes the cursor position that was saved in Freeview.
-
Save Cursor – Saves the MMVT cursor position to be viewed on Freeview.

-
Save Image – Saves an image of the brain area.
-
Save all Perspectives – Saves all the major perspectives of the brain (Anterior, Inferior, Superior, Posterior, Left, Right, Medial).
-
Save the Colorbar – Saves an image only of the colorbar.
-
Colorbar – Adds colorbar to the saved images (check this box before saving the images).
-
Ticks – Sets the number of ticks in the colorbar.
-
Size – Sets the size of the ticks in the colorbar.
-
Split Views – Saves both sides of the split brain in one image.
-
Fit Image into View – Fits automatically the view on the brain when the image is saved.
-
Folder Path – Sets the saved images location.
-
List (File Type) – Sets the image file type.
-
View Distance – Changes the distance of the 3D brain modal from the front (changes the size of the brain). Same can be done by scrolling the MMB.
-
Resolution – Sets the resolution of the image.
-
Black/White – Sets the background color of the brain & colorbar.
-
Camera View – Switches the appearance into Rendered Brain mode and captures all the presented objects in the camera view.
*After pressing the button more settings regarding the camera view are opened and the button changes its name to ‘Object View’.
-
Object View – Exits the camera mode.
-
Render image (changed from save image) – Saves the image in the subjects ‘figures’ folder.
Example: ..mmvt_root/mmvt_blend/colin27/figures
-
Quality – Sets the image resolution (size of the image file).
-
Lighting – Changes the light levels.
*Tip: Very useful when rendering with white background. Lower the light level to have a better contrast.
-
Background rendering – Renders via another Blender in the background.
-
Show Camera Props – Opens fields to change the axis value of the camera view.
-

Searches all objects types in MMVT.

-
Load stc File – Loads an MNE source estimate file.
-
Load Evokes File – Loads an MNE evokes file by creating the sensors objects and importing the sensors level evoked response.
-
Load Surface nii File – Loads surface NIfTI files (nii, nii.gz, and mgz).

*Works only in rendered brain.
-
Show Solid Brain – Sets the transparency value from 0 to 1 (mostly transparent to mostly opaque).
-
Depth – Sets the amount of surface layers that will be seen.
Shows the value in the selected vertice.
-
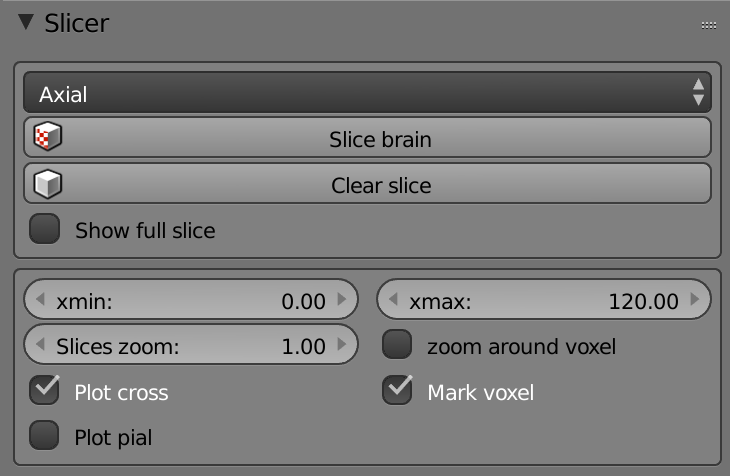
List (Axis) – Sets the slicing axis.
-
Slice Brain – Slices the brain according to the axis and the cross position.
-
Clear Slice – Resets the brain.
-
Show full Slice – Shows the full image of the slice.
-
Xmin – Sets the black color intensity in the brain slices.
-
Xmax – Sets the white color intensity in the brain slices.
-
Slices Zoom – Zooms in the slices view.
-
Zoom Around Voxel – Zooms around the center of the cross.
-
Voxels – Sets the square number of voxels displayed in the slices view.
-
Smooth – Smooths the slices view.
-
Plot Cross – Hides/Shows the cross in the slices view.
-
Mark Voxel – Hides/Shows the cross center.
-
Plot Pial – Plots the Pial surface on the slices view.
-
Color pallet – Sets the color of the plotted Pial surface.

-
Cortical Labels Data:
-
List (Labels) - Selects labels file from the subject’s labels folder:
../mmvt_root/mmvt_blend/colin27/labels/labels_data
-
Color Labels Homogeneously – Colors the labels after pressing the ‘Plot labels’ button )works only in ROIs mode).
-
Find Label on Click – Writes labels name below the checkbox each time LMB clicked on the brain.
-
Plot Label’s Contour – Plots labels contour each time LMB clicked on the brain.
-
Plot Labels – Plots labels on the brain.
-
Load Labels File – Loads labels data file (npz/mat).
-
-
Plot Labels as Contour – Plots the labels as contours only.
-
Contours:
-
List (Atlas) – Selects the atlas to plot the labels contour.
-
Plot Contours – Plots the labels contours according the selected atlas above.
-
List (Labels) – List of all labels names. Plots selected label contour.
-
Filter - Filters the labels list by a regular expression.
-
-
Creating a New Label:
-
Plot a Label – Plots label files of MNE type.
-
Text Area - Creates the labels name.
-
Radius (mm) – Selects the labels radius.
-
Grow a Label – Creates the label according the features selected above.
-
-
Clear Contours – Clears the plotted contours.
-
Clear – Clears all.

-
List (Scripts) – List of script in the folder: ..\mmvt_root\mmvt-code\src\examples\scripts
-
Run Script – Runs the selected script above.

-
List (Streaming) – Streaming types.
-
Edit Settings – Edits streaming setting.
-
Stream data – Starts to listen to the streaming data.
-
Save Streaming Data – Records the streaming data.
*Adds another option in the list to play the data under the term ‘offline’.
-
Curves Separation – Separates the curves in the Y axis.
-
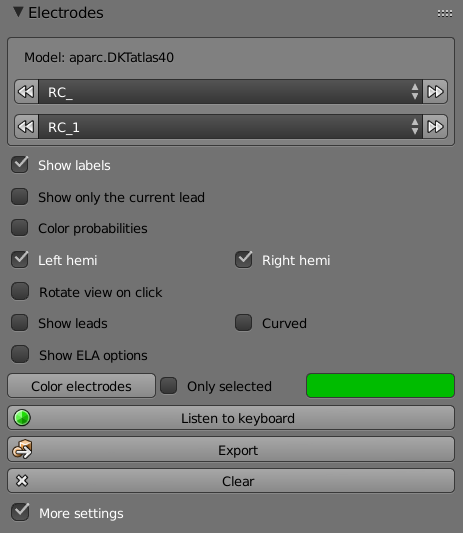
List (Leads) – Selects leads name.
-
List (Electrodes) – Selects each electrode on the selected lead.
-
Display Window – Shows the regions names and the probabilities for where the signals coming from.
-
Show Labels - Shows the label of each electrode.
*Shows only the selcted electrode in orange color. To see all the labels in orange color go to the Selection Panel, make sure the first item is set to "All conditions", and click on the Electrodes button.
*The labels will not be shown when saving an image. The only way to see them is by capturing the screen. -
Show Only the Current Lead – Shows only the last selected leads.
-
Color Probabilities – Plots the labels with the highest probabilities the signal for the electrode was received from.
-
Left Hemi – Shows only the electrodes in the left hemisphere.
-
Right Hemi - Shows only the electrodes in the right hemisphere.
-
Rotate View on Click – Rotates the view of the brain to show the selected electrode.
-
Show Leads – Shows the leads connecting the electrodes.
-
Color Electrodes – Colors all the electrodes with the selected color.
-
Color Bar – Selects the color to color the electrodes.
-
Listen to Keyboard – Opens a window with instructions on how to use the keyboard to select electrodes.
-
Clear – Clears all the plotted activity.
*For deselecting the electrodes go to the ‘Selection Panel’ and press the ‘Deselect All’ button.


-
Update MMVT – Updates the tool with the latest version.
*Works on Linux only.
Anatomy
-
Atlas Name – The brain is parcellated according to this atlas.
-
Import Brain - Imports all the brain objects created using the anatomy preprocessing pipeline (src.preproc.anatomy).
-
Import Flat Surface – Imports the flat brain.
-
Electrodes
-
Electrodes’ Radius – Sets the electrodes/spheres radius.
-
List (Electrodes File) – Selects the electrodes position file.
-
Bipolar – Sets whether the electrodes are bipolar or not.
-
Import Electrodes – Imports the electrode objects.
-
Add Data to Electrodes – Adds the data to the electrodes.
-
Load Electrodes Positions – Loads electrodes coordinates from a given file.
-
Overwrite – Overwrites the existing electrodes data.
MEG Source Estimate
-
List (Evoked Response) – Selects the source estimated evoked response.
-
Add MEG Data to Brain – Adds the evoked data.
-
**Add Data to Labels **
-
Add Condition Difference Data
-
Overwrite – Overwrites the existing evoked data.
-
Import Unknown – Imports the data of all unknown labels.
MEG Sensors
-
Import MEG Sensors – Imports MEG Sensors objects.
-
List (MEG Sensors) - Selects the MEG sensors data file.
-
Add data to MEG Sensors – Adds MEG sensors data.
EEG Sensors
-
Import EEG Sensors – Imports EEG Sensors objects.
-
List (EEG Sensors) - Selects the EEG sensors data file.
-
Add data to EEG - Adds EEG sensors data.
-
List (Connectivity) – Selects the connectivity file.
-
Check Connections – Checks the connections number above the threshold.
-
Create Connections – Imports the connections objects.
-
Threshold – Sets the threshold to calculate the connections number.
-
List (Methods) – Selects the method used to calculate the number of connections using the threshold.
-
List (Connections) – Displays the connections within/between hemispheres.
-
Filter Connections
-
Filter Nodes – Hides all the nodes with no edges.
-
Update